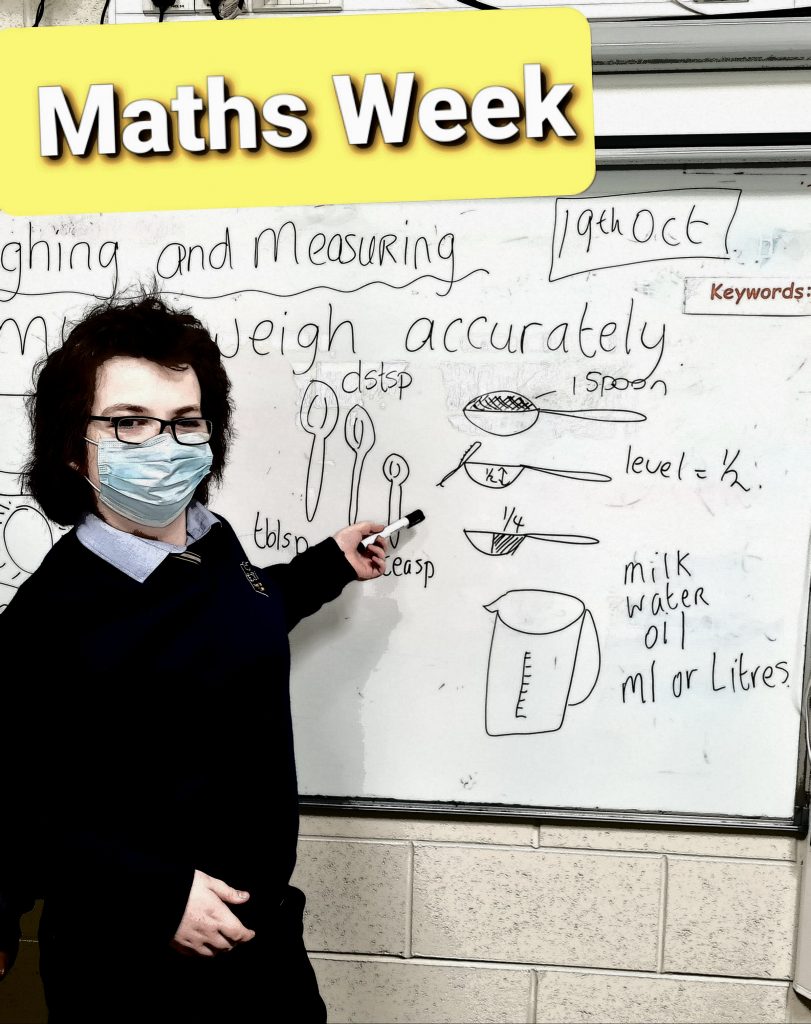
Maths Week 2021

Last year you may remember we tried to encourage as many teachers as possible to use Venn Diagrams as a teaching aid in their classes to reinforce a key maths concept that is new to students at secondary level; the year before we promoted scaled Timelines as a way of improving essential numeracy and motor skills.
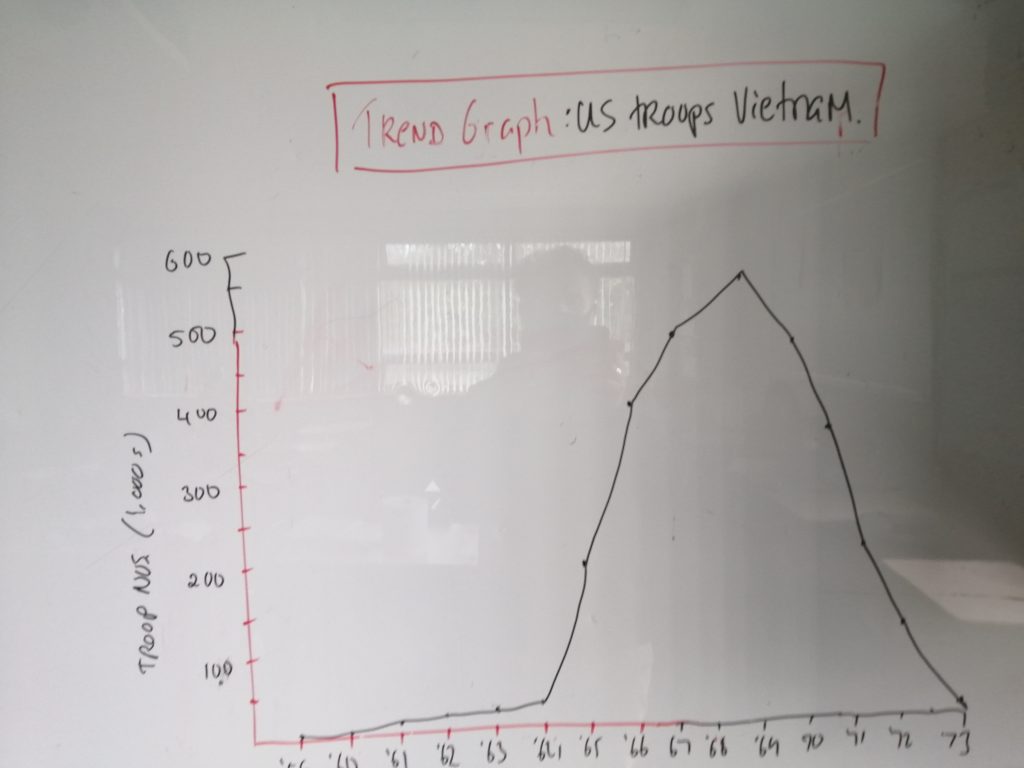
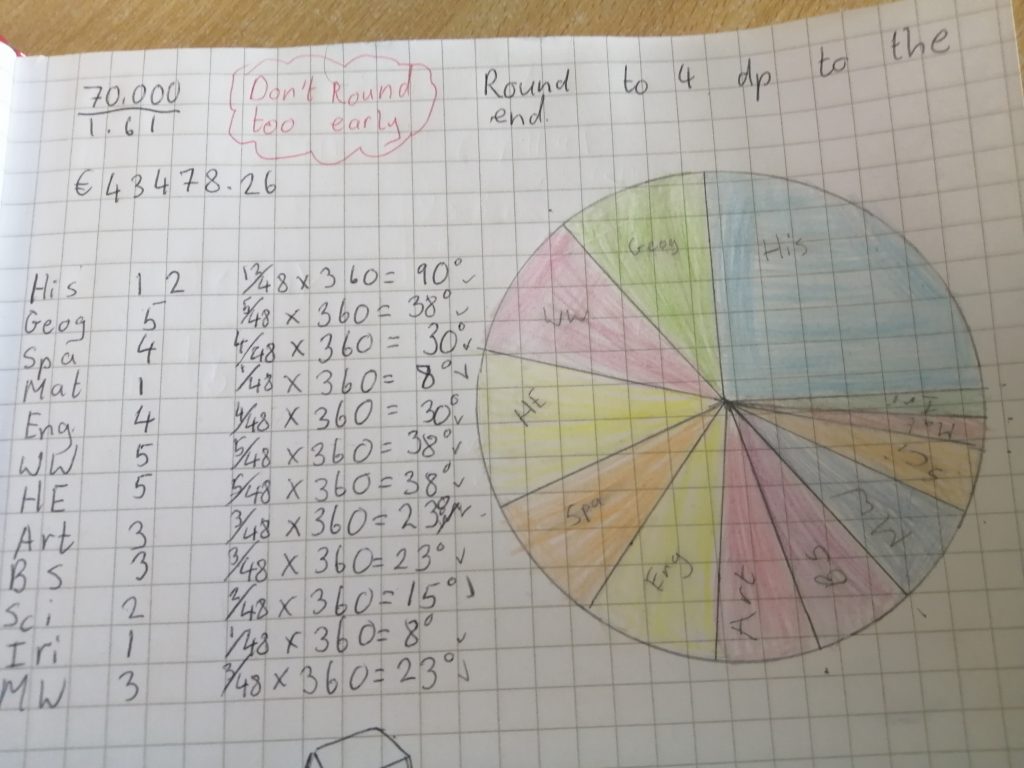
This year the Maths dept. were going all out on …GRAPHS! Yup Graphs. We have a common policy on graphs, the S.A.L.T. method: scale axis label title. So whether it’s a bar graph, a line plot, a trend graph or if you’re up to it a Pie Chart for all you high achievers get graphing and remember maths ain’t just for maths week.
There was also daily maths problem to solve on the school Facebook page and well done to all who got the correct answers!!
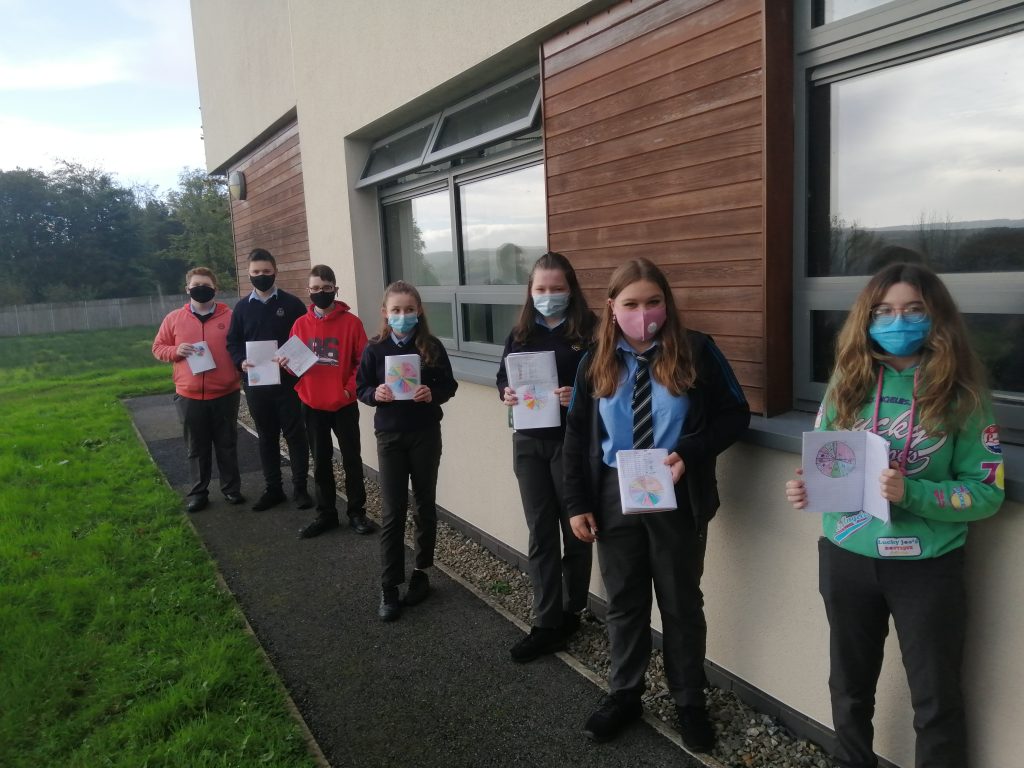
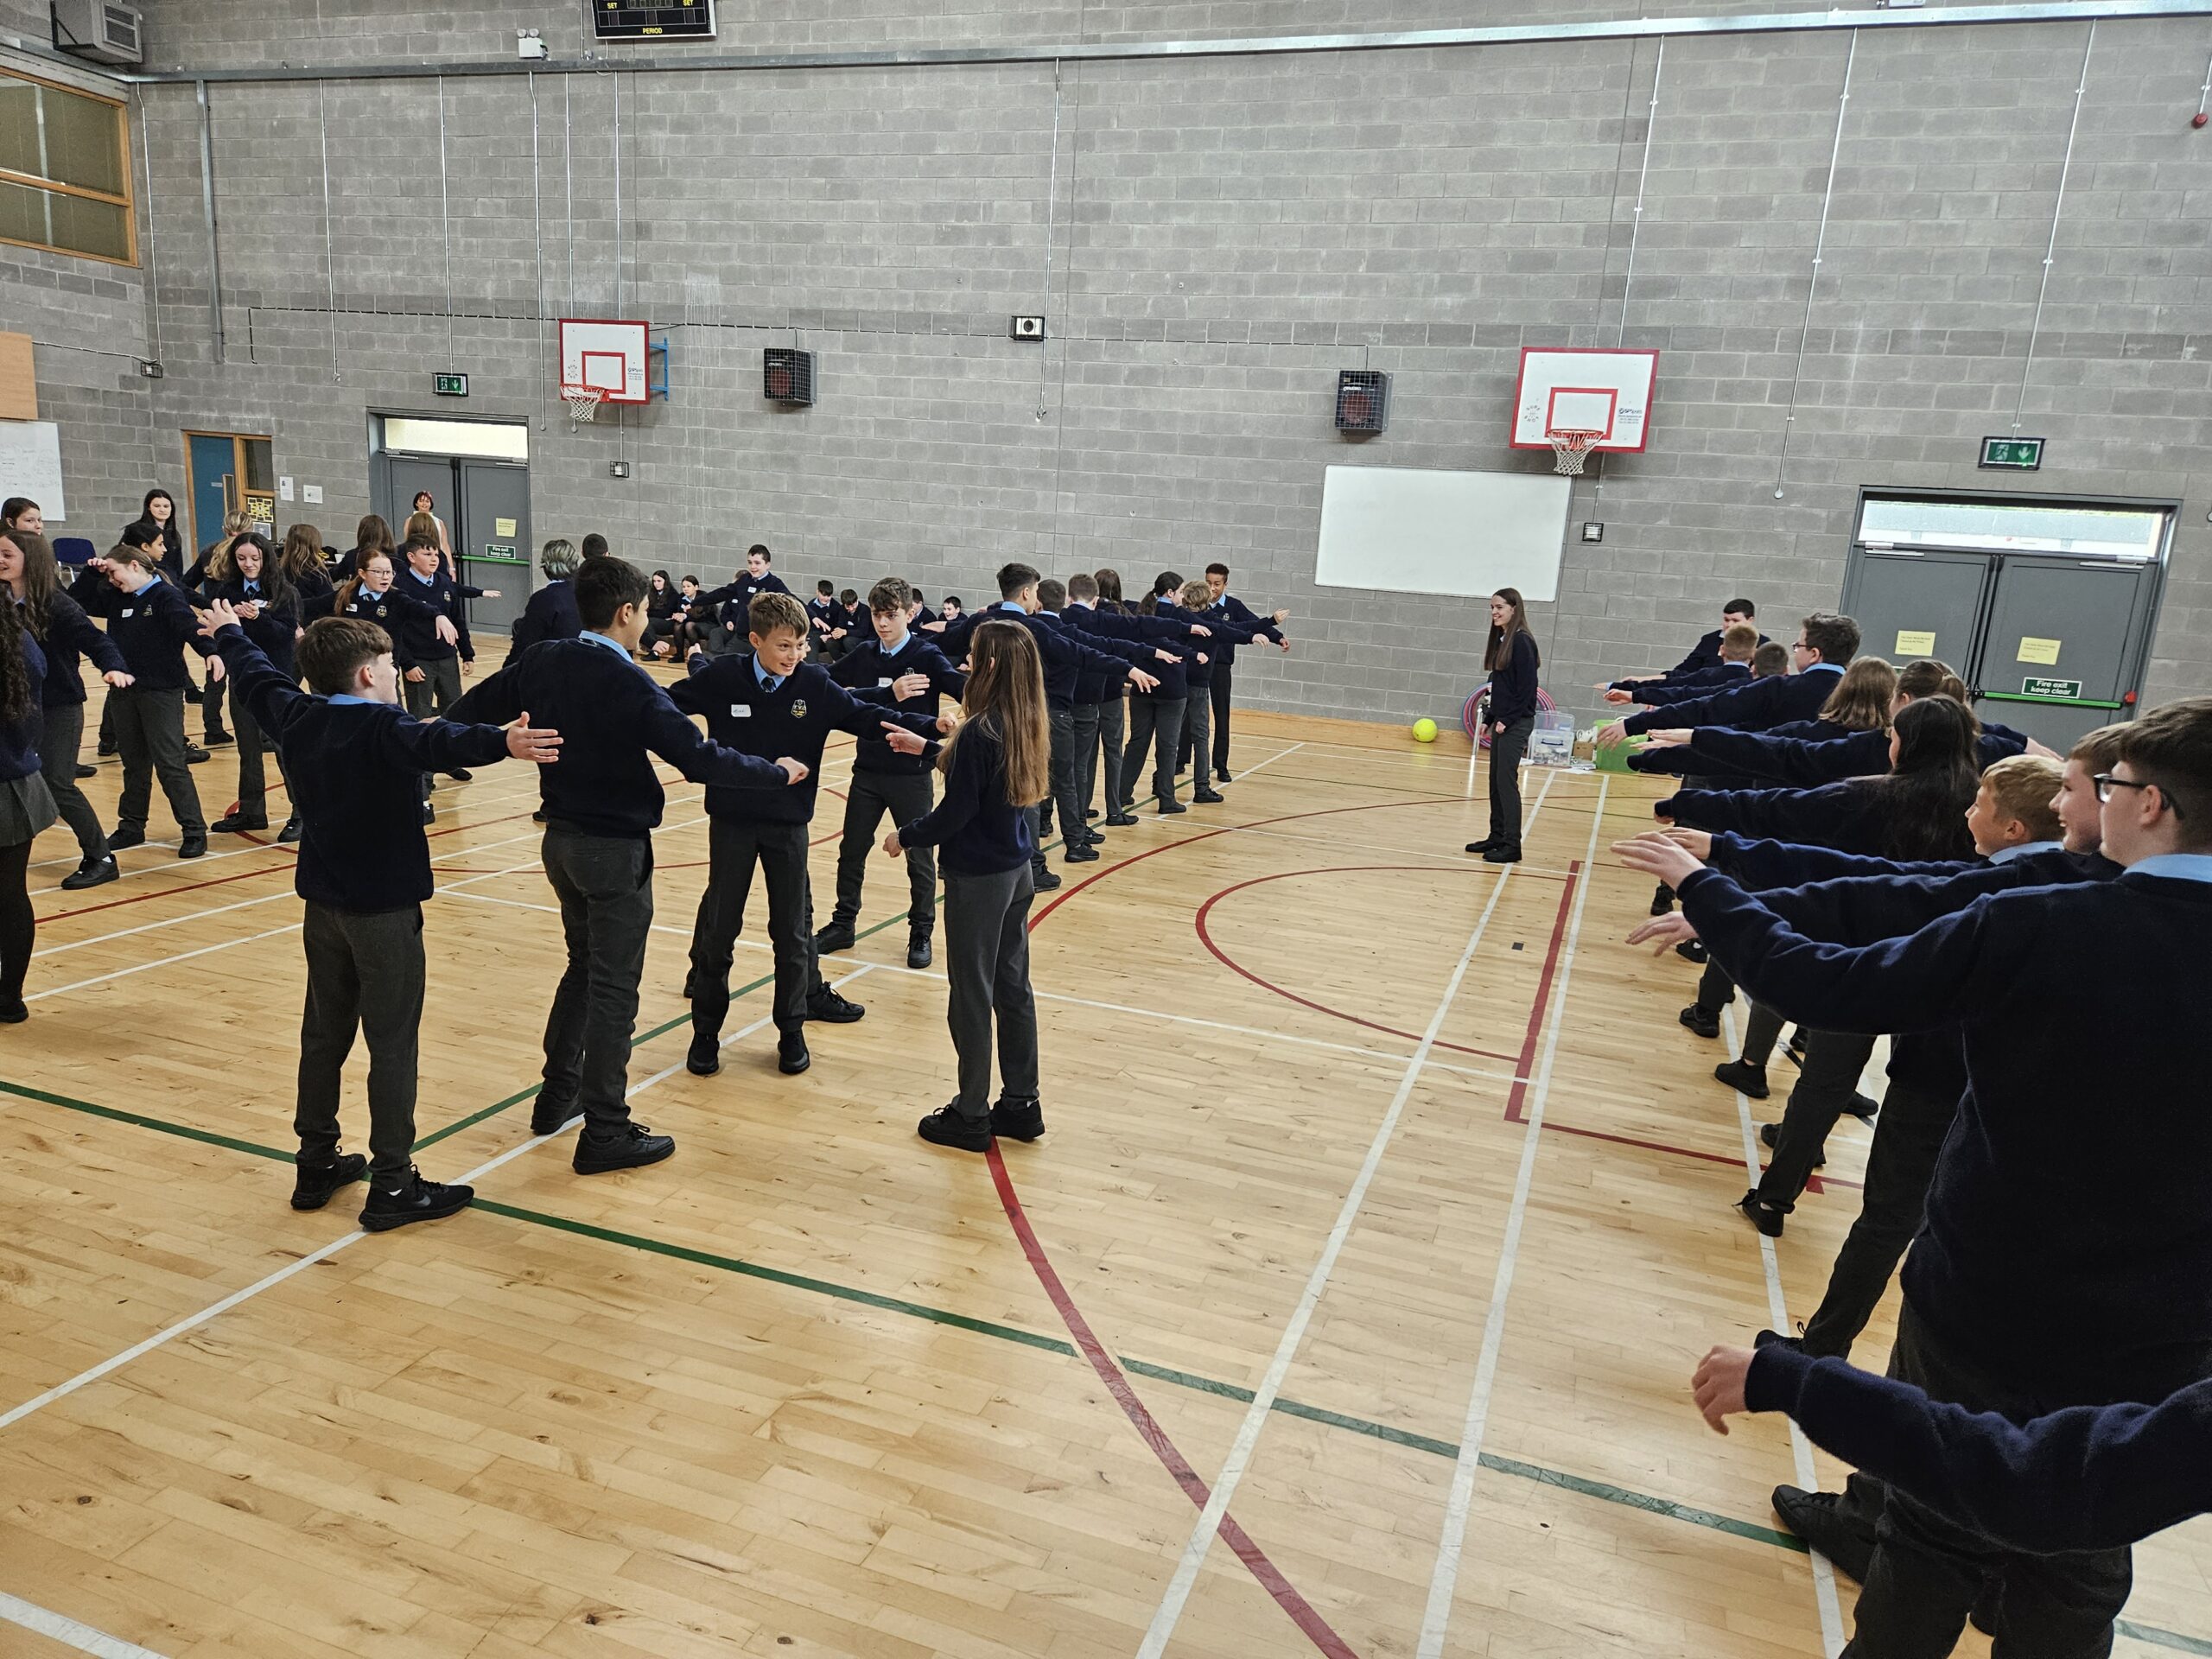
Well done again to all the staff and students who participated and got creative in using Maths to present their work not only in the Maths classroom but across a number of subjects.
dav